It’s reasonable to claim that the biggest success story in the history of psychology research is the development of the IQ test. An IQ test is a serious predictive tool, unlike most of what is put out by “social psychologists,” “behavioral scientists,” “behavioral economics,” “nudge theorists,” and so on. For a taste of IQ’s success, one meta-analysis with a combined sample size of over 90,000 people found that IQ is the most powerful known predictor of subjects’ levels of occupation, education, and income (Strenze 2007).
The Black-White IQ gap is stable
As Charles Murray and Richard Herrnstein argued in The Bell Curve, IQ is extremely relevant to social policy. There is a gap between the average scores of white test takers and black test takers of about 15 IQ points, or one standard deviation. This black-white IQ gap has been measured since the 1960’s. Occasionally, some claim it has shrunk, often through the use of tests with poor predictive validity and non-random samples.
Following claims of a shrinking gap, a 2012 meta-analysis conclusively found no such evidence of shrinkage (Rushton 2012), meaning the black-white IQ gap had remained stable for almost 50 years after the Civil Rights movement, which led to the government becoming extremely financially supportive of blacks through desegregation and affirmative action.
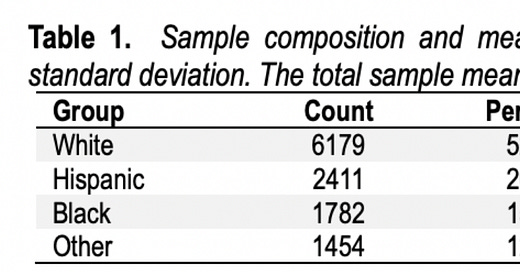
A recent, representative sample of 12,000 found a black-white IQ gap of over 18 points (Kirkegaard & Fuerst 2023). The gap is not closing despite over half a century of welfare to blacks.
The Black-White IQ gap is the essential cause of important race disparities
When controlling for IQ, huge chunks of most racial performance gaps vanish (Herrnstein & Murray 1994, 320-340). When they have the same IQ as whites, blacks are more likely than whites to graduate from college and to attain a high status occupation. Blacks, after controlling for IQ, make just as much money as whites and are only 5% more likely to be in poverty than whites.
Without controlling for IQ, blacks are 20% more likely to be in poverty than whites. Low IQ is an immediate and primary reason for poor black performance. Consequently, knowing the cause of the black-white IQ gap tells us a significant part of the cause underlying racial performance gaps.
Heritability
Heritability is an important concept when it comes to understanding the causation behind the variance of a metric like IQ. Heritability is the proportion of variance of a trait that is explained by variance of relevant genetics. With classical techniques, heritability can only be directly measured within a population. Using only classical methods, the “heritability” (proportion of the gap that is due to genetic differences) of the between-groups gap has to be inferred indirectly. Luckily, decades of classical behavioral genetics research has provided more than enough data to allow for such an inference.
Let’s start with the within-race heritability of IQ. For first world whites, this figure is one of the most well replicated findings of psychology and behavioral genetics. A meta-analysis with a combined sample size of 11,000 twin pairs from white countries found that the narrow sense heritability of IQ is roughly 66% at age 17 (Haworth et al. 2010).
Before the age of 17, the heritability of IQ is usually measured to be lower (this is called the Wilson Effect). This doesn’t mean that IQ is more permanently malleable when someone is a child. For example, intervention programs and other tactics designed to raise the IQs of children tend to produce an effect in childhood that fades by adulthood (Jensen 1969) (Protzko 2015). This “Wilson Effect” could be a result of poorer g-loading and reliability of child IQ tests. Child IQ data is in fact less reliable (Jensen 1973, 82). Since variance due to measurement error is included in the “nonshared environmental variance” umbrella in the standard model, the fact of lower reliability of child IQ tests does explain at least some portion of the Wilson Effect. The possible reasons for poorer reliability are intuitive: the test may be inferior in its increased simplicity, developmental differences between children of the same age may cause noise, and so on. But whatever it is, it disappears by adulthood, alongside childhood advantages driven by non-genetic factors.
Other studies have found that what is not explained by genetics is mostly explained by unshared environment (McGue et al. 1993)(Bouchard & McGue 2003), which is defined as the environment that two children raised together don’t share (so not parental behavior or other aspects of family environment, or the school that they share). Unshared factors might vary from person to person, but on the aggregate they include peer groups and stochastic effects and exclude family pressures and school quality.
Above we cited the narrow sense heritability. The environmental component of IQ is not 33%. Narrow sense heritability is confined to additive effects. There are non-additive genetic effects which do not tend to be shared between family members. In typical methods that calculate “narrow” heritability, non-additive genetic factors are lumped into the unshared environment component. Using narrow sense heritability as a signal for “malleability” can lead to underestimates.
Identical, a.k.a. monozygotic, twins share all their genes, so they also share non-additive effects. IQ heritability estimates using monozygotic twins reared apart tend to return values of 75% to 85% for broad sense heritability.
Above is what a heritability of 81% looks like, where X is hypothetical gene-score, and Y is measured IQ. As you can see, someone with average genes can’t do much better than 110 IQ even under the best environments. Someone with an IQ of 85 can’t become above-average. Malleability is very low.
The point of discussing these details about the within-group heritability of IQ is not to attempt to claim that the heritability of the black-white IQ gap is the same. Rather, it’s simply to establish that genes have a large say in determining IQ within a population. This gives us a prior that genes may be important in explaining the black-white IQ gap.
Do black and white environments differ?
With that in mind, the next question is: how do the black and white IQ-relevant environments differ on the average? If the races have the same IQ-relevant environment on the aggregate, the heritability of the black-white IQ gap is 100% because the totality of the difference must be due to difference in the two gene pools. The lesser the heritability of the black-white IQ gap, the worse the black IQ-relevant environment must be when compared to the white IQ-relevant environment.
Race is real
It is highly unlikely that the heritability of the black-white IQ gap is insignificant given both the knowledge on within-groups heritability and the simple truth that race is real. Black people and white people look significantly different. Did evolution stop at the skin? No. For instance, blacks and whites have different norms for healthy kidney functioning. If evolution was significant enough that we can see it, and it didn’t stop at the skin, it’s doubtful it stopped at the neck, especially when the obviously divergent aggregate behavioral patterns of the races are noticed. But suffice it to say that computers can classify ancestry groups by DNA and match self-reported race with 99% accuracy (Bamshad et al. 2003).
Another study (see image) graphed racial clusters as identified by a computer, found they matched self reported race, and that the clusters group semi-discreetly (Guo et al. 2014). Africans were the most divergent from other racial groups, including whites. Both the data and evolutionary theory predict that there is some significant degree of heritability in regards to the black-white IQ gap. It would be improbable for the IQ-relevant gene pools to be the same or to produce the same IQ-phenotypes in the same environment. Is there evidence, then, showing that US blacks have extremely deprived IQ-relevant environments such that this data-trend can be overcome?
Three types of environmental excuses and the MTRAS
There are roughly three types of environmental factors that environmentalists like to point to: test bias, physical factors, and psychological factors. The first one involves the claim that IQ tests are not measuring a real difference in intelligence between blacks and whites because IQ tests are alleged to be culturally be biased. Black people are thought to do only superficially poorly. This hypothesis has been debunked since the late 20th century – in 1987, it was found that the difference between black and white scores on questions independently deemed to be culturally biased as actually less than the differences on less “biased” test questions (Jensen & McGurk 1987), leading the authors to conclude that racial testing differences reflect a real difference in intelligence. Jensen also wrote a whole book on this in 1980 titled Bias in Mental Testing which came to the same conclusion as the 1987 study.
Next, environmentalists, having accepted the reality of the intelligence difference, like to claim that blacks have a disadvantaged IQ-relevant physical environment on the aggregate (with the implication that if true, this is white people’s fault). Specifically, it’s claimed that blacks live in poverty due to white people, which impacts black nutrition and school quality, which depresses their IQ scores. The simplest way to show that this doesn’t matter is that when these factors are controlled for, the black-white IQ gap doesn’t dissipate.
The Minnesota Transracial Adoption Study (MTRAS) tracked blacks, 50/50 black-white mixes, and whites who were adopted out to white middle class parents at very young ages. At the least, variance in age at adoption in the study didn’t matter – the correlation between IQ at 17 and age at adoption was only 0.13. Unless there exists racism so pervasive as to make adopters of black orphans give those orphans a significantly impoverished environment due to their skin color, this study effectively controls for socio-economic status, nutrition, school quality, and a whole host of other factors that could be hypothesized to be depressing black IQ. To the affirmation of the theory of evolution, the MTRAS found a black-white IQ gap of one standard deviation between black and white adoptees in young adulthood, the same gap that’s found in the normal population (Weinberg et al. 1992). It also found that the gap between the mixed race adoptees and the other groups was about half a standard deviation, which is good evidence against the racism narrative (Drake and Obama are “black”) and excellent evidence for the genetic hypothesis.
More convincing is that what the MTRAS data is corrected for the Flynn effect, the racial gaps slightly widen (Sternberg 2000, 185). This is probably because the Flynn effect size on a test correlates negatively with g loading, from -0.40 to -1.00 (te Nijenhuis, & Van Der Flier 2013), while the race gap correlates positively with test item g-loading.
The MTRAS is a sublime piece of evidence, but it is corroborated by others. For example, the black-white IQ gap remains roughly the same at all income levels (Herrnstein & Murray 1994, 288), meaning lower group income couldn’t be the cause. It’s also likely that income-matched families are also nutrition-matched, school-matched, and so on. If this is the case, then neither poor schools nor poor nutrition nor whatever else are causes of the black-white IQ gap. In regards to schools in particular, voucher studies reveal that school quality does not cause or correlate with changes in student performance (Chrisman et al. 2012) (Wolf et al. 2010), something which is much less heritable than IQ yet highly correlated with the latter.
After accepting that depressed black IQ is almost certainly not caused by “poor schools” or bad nutrition or low income, the environmentalist typical moves on to claims about the specter of slavery and segregation. But black IQs around the globe tend to be depressed relative to white IQs. Unlike the Irish, whose IQs were depressed but rose when they urbanized, urbanized blacks still feature depressed IQs no matter the country (although US blacks tend to have higher IQs than African nationals). The same IQ gaps exist in the US, the UK, and South Africa, (Lynn 2015, 63) (Rushton & Skuy 2000) (Lynn & Meisenberg 2010) despite their divergent histories on the treatment of black people.
Next they might speak of stereotype threat or black culture. Not only is stereotype threat a priming effect, there is no evidence that it explains racial gaps on actual IQ tests (Stricker & Ward 2004) (Wei 2008).As for black culture, not only is culture a function of genetics, but motivation measuring items are the only test items blacks tend to do better on than whites (Jensen 1973, 111-113). This means that blacks aren’t scoring poorly because their culture just makes them think “dis test shit wack yo.” And finally let it be remembered that the mixed race adoptee data from the MTRAS essentially destroys the systemic racism narrative.
That narrative is further discredited by the previously shown data that reveals that blacks and whites with equal wealth experience the same IQ gap. And, furthermore, when IQ is controlled for, most racial performance gaps disappear. What systemic racism can there be, then, that would cause a one standard deviation IQ gap? Blacks would have to be treated so poorly by whites after controlling for income, nutrition, and school quality that it causes there to be essentially no black geniuses. And in every country on Earth! If systemic racism really were this severe in a country where being black is worth 230 free SAT points (Epenshade et al. 2004), then it would be a waste of time combatting it at all. The races would be better off going their separate ways.
Other lines of classical evidence
Environmentalism has been falsified. But there is still more positive evidence for a genetic difference being responsible for at least most of the black-white IQ gap. Sibling regression toward the mean is one line: a black sibling of someone with an IQ of 120 will have an IQ of about 100, while a white sibling would have an IQ of about 110 (Jensen 1973, 118). This implies differential nonadditive genetic effects, especially when combined with the dearth of evidence for an IQ-relevant environment gap. Another line of evidence is that the blacks have a smaller standard deviation for IQ than whites (Jensen 1973, 212). This means that if blacks and whites have a similar IQ-relevant gene pool, black heritability will be higher than white heritability because there must be less environmental variance overall for black people. But this is not the case, suggesting that the black IQ gene pool is dissimilar to the white IQ gene pool (if the variance in environment is similar).
All the evidence seems to corroborate the idea that the black-white IQ gap is mostly explained by differences in black and white IQ-relevant gene pools and not differences in IQ-relevant environments. It is virtually certain that the heritability of the gap is at least 50%, but the current state of the evidence warrants giving an estimation of 100%. At this point, the only evidence that can cast doubt on this position is that which demonstrates that an environmental reduces the black-white IQ to an extent that is statistically significant. But since environmentalists are heavily funded and have had decades to find their factors, it’s probably safe to say they’re wrong.
New evidence: GWAS
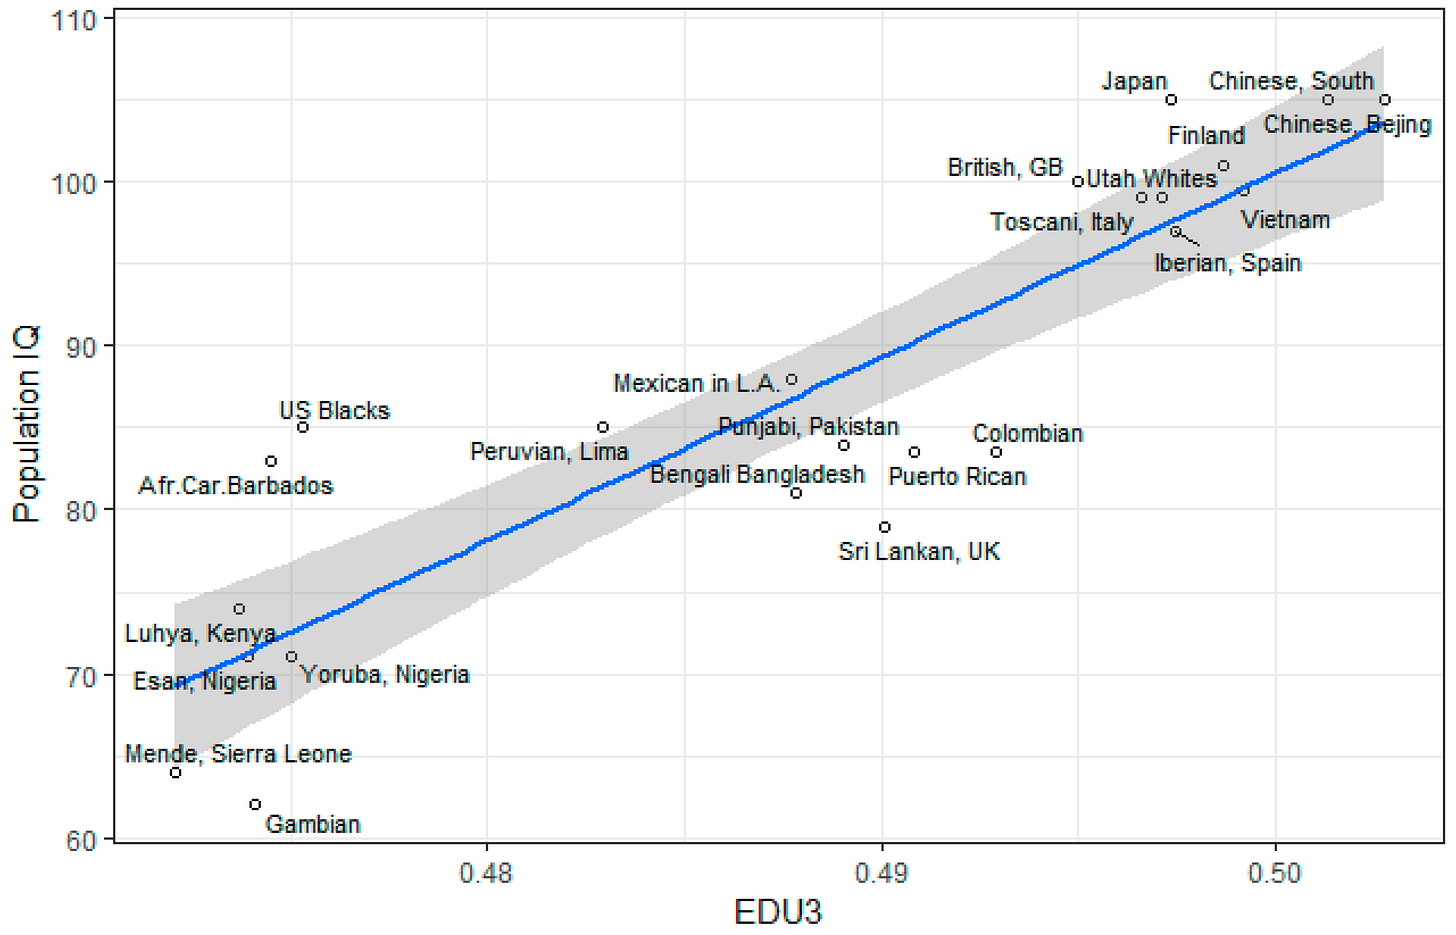
Piffer (2019) found average EDU3 polygenic scores in a population accurately predicts the average IQ for that population. Blacks were predicted to have lower IQs genetically than they actually have, indicating that perhaps white interventions are already increasing or maximizing their IQ over what it would be if they had to live alone, without white people, like in Liberia. Imagine no white policing, no white food stamps and public schools and school lunches, no white section 8 housing, no white media and books, no affirmative action to white-build Harvard, no white-invented medical care, etc. If black people had to live with what they invented, they’d be living in mud huts piercing each other with spears, because they invented precisely none of the modern world. This would probably lower their IQs, but it would be their fault.
New evidence: Machine Learning on MRI data
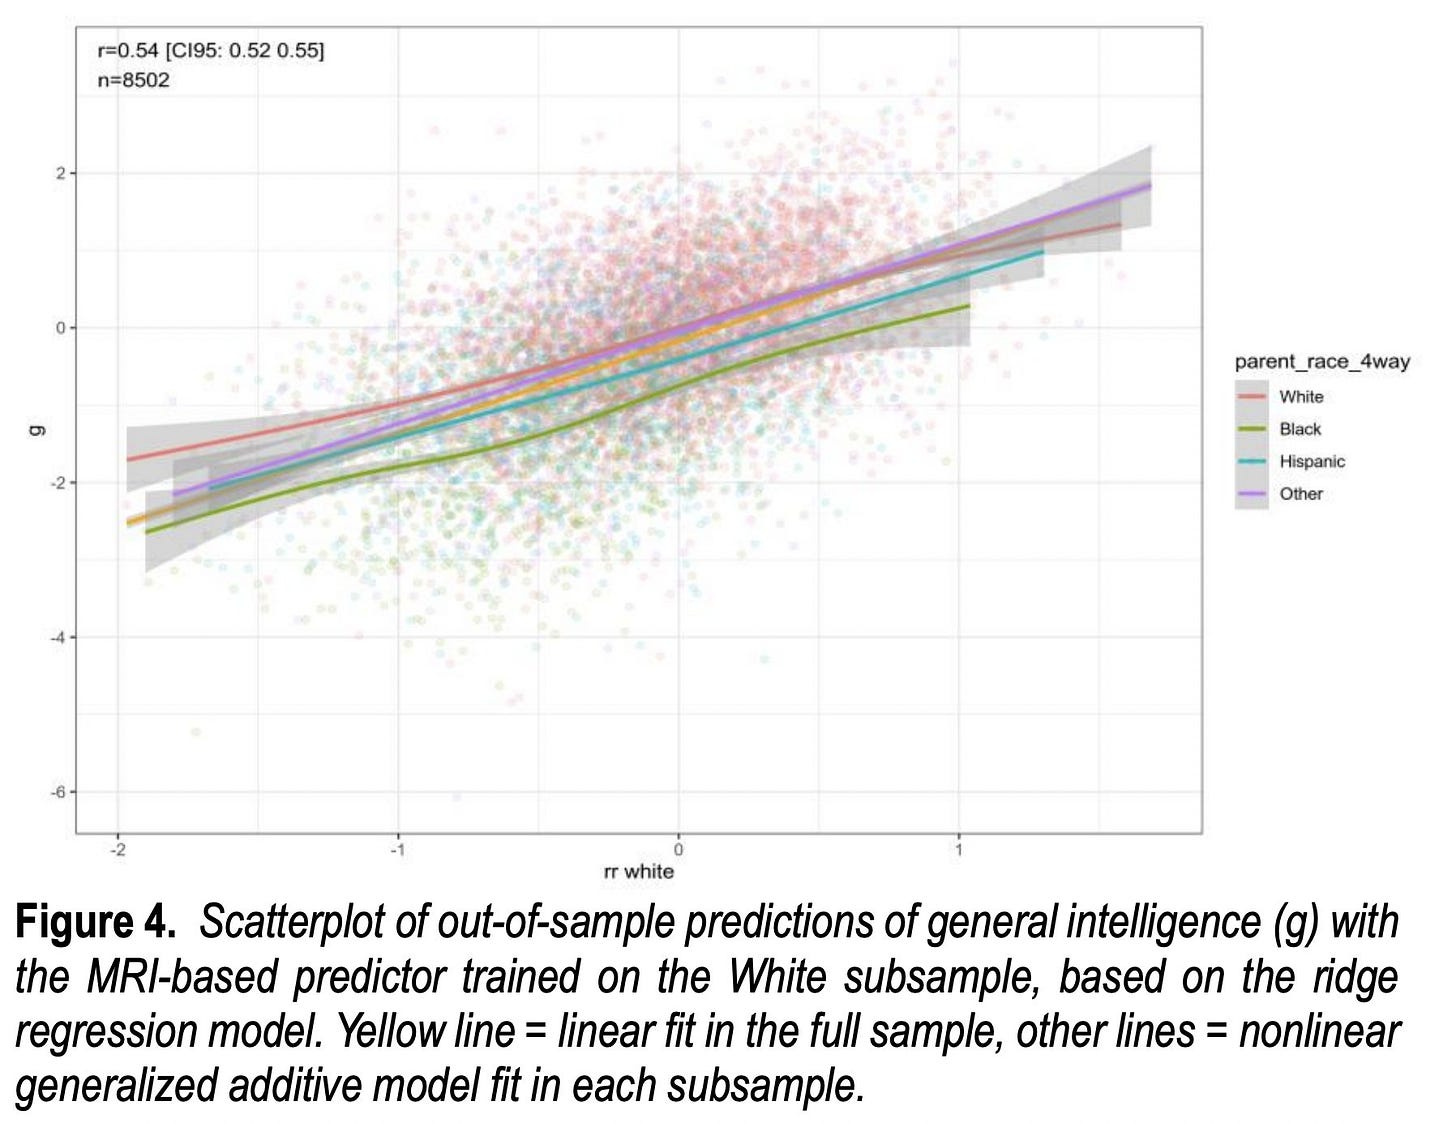
Kirkegaard & Fuerst (2023) trained a machine learning model on 50,000 parameters from MRI brain scan data. The training sample was only white. It correctly predicted the black sample mean to be 82. This means black brains are structurally lower IQ. This could only be caused by “hard” environmental causes or genetics, not culture or stereotype threat. But despite 60 years and billions of dollars of funding, and Nobel prize waiting for anyone who discovers it, while hereditarians are censored top-down, nobody has discovered any hard environmental cause of the gap, such as lead, vitamin D, or microplastics. Lead was hyped up for a while, but ultimately explained less than a point of the gap at most. Many such cases.
New evidence: Admixture analysis
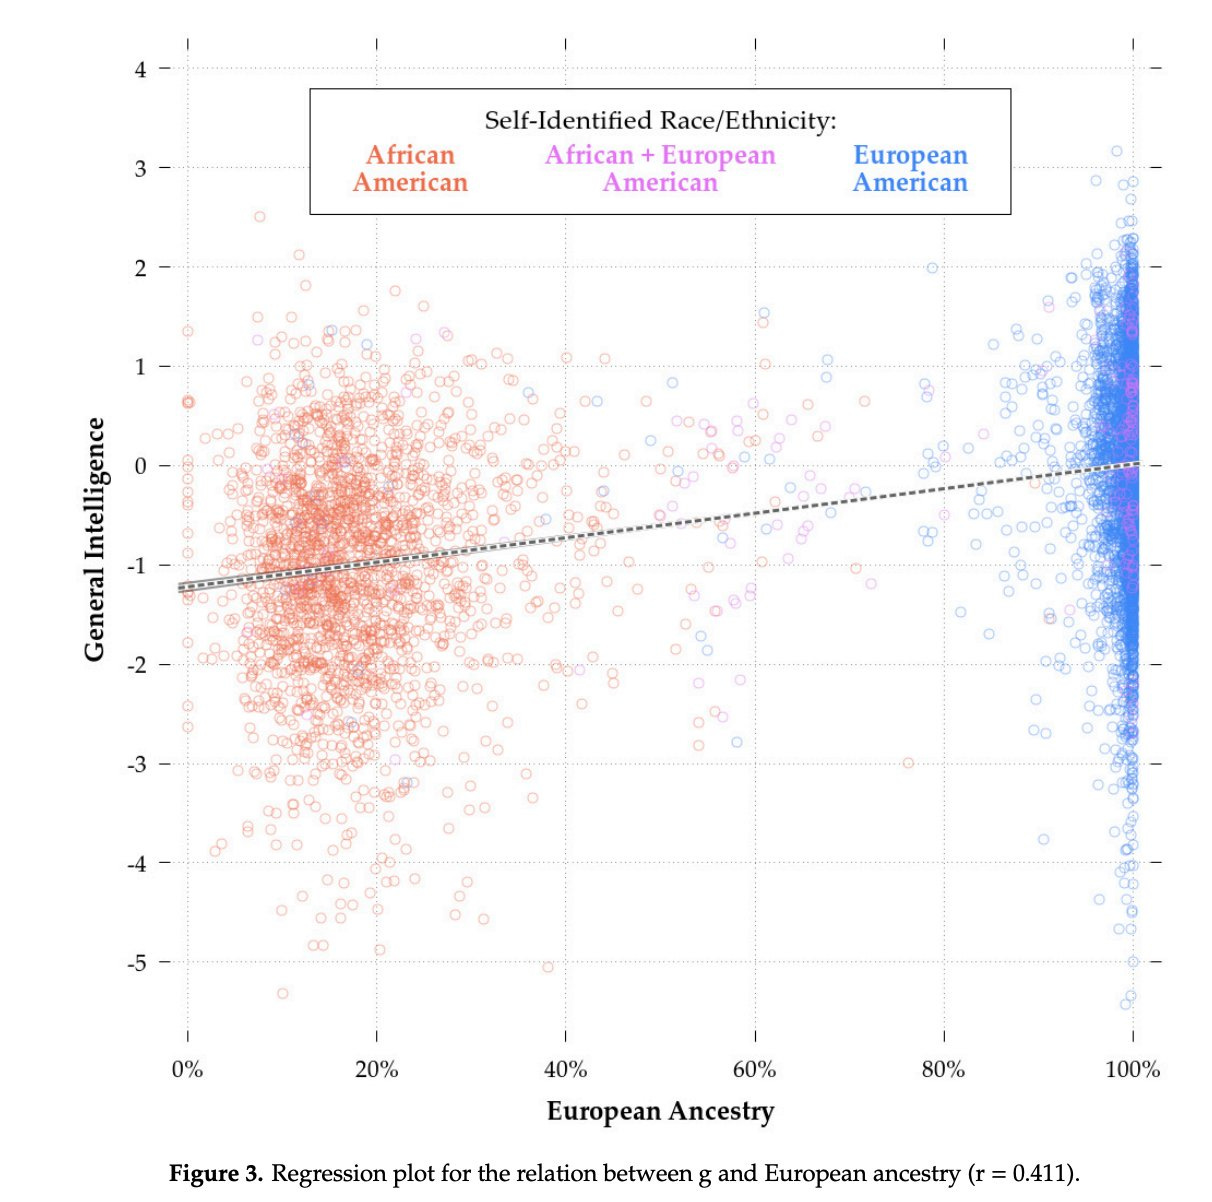
The MTRAS wasn’t a fluke, proportion of white ancestry linearly predicts IQ (Lasker et al. 2019). This sets a lower bound on the heritability of the gap to be 50%, but the data fits with a 100% gap heritability as well.
Hilariously, communists have tried to claim “colorism” means lighter skinned blacks are less oppressed, and that explains these results. When you control for skin color, however, the results stand. As if “colorism” even had to be debunked.
REFERENCES
Bamshad, M. J., Wooding, S., Watkins, W. S., Ostler, C. T., Batzer, M. A., & Jorde, L. B. (2003). Human population genetic structure and inference of group membership. The American Journal of Human Genetics, 72(3), 578-589. https://www.ncbi.nlm.nih.gov/pmc/articles/PMC1180234/
Bouchard Jr, T. J., & McGue, M. (2003). Genetic and environmental influences on human psychological differences. Journal of neurobiology, 54(1), 4-45. https://web.archive.org/web/20161114181852/http:/isites.harvard.edu/fs/docs/icb.topic1169974.files/Bouchard%20McGue%202003.pdf
Chrisman, J., Swenson, D., la Tarte, A., & Natzke, N. (2012) Test Score Data for Pupils in the Milwaukee Parental Choice Program (Report 5 of 5). http://legis.wisconsin.gov/lab/reports/12-14full.pdf
Espenshade, T. J., Chung, C. Y., & Walling, J. L. (2004). Admission preferences for minority students, athletes, and legacies at elite universities. Social Science Quarterly, 85(5), 1422-1446. https://web.archive.org/web/20180907052552/https://www.princeton.edu/~tje/files/files/webAdmission%20Preferences%20Espenshade%20Chung%20Walling%20Dec%202004.pdf
Guo, G., Fu, Y., Lee, H., Cai, T., Harris, K. M., & Li, Y. (2014). Genetic bio-ancestry and social construction of racial classification in social surveys in the contemporary United States. Demography, 51(1), 141-172. https://www.ncbi.nlm.nih.gov/pmc/articles/PMC3951706/
Haworth, C. M., Wright, M. J., Luciano, M., Martin, N. G., de Geus, E. J., van Beijsterveldt, C. E., … & Kovas, Y. (2010). The heritability of general cognitive ability increases linearly from childhood to young adulthood. Molecular psychiatry, 15(11), 1112-1120. https://www.ncbi.nlm.nih.gov/pmc/articles/PMC2889158/
Herrnstein, R. & Murray, C. (1994). The Bell Curve.
Jensen, A. (1969) How Much Can We Boost IQ and Scholastic Achievement. Harvard Educational Review: April 1969, Vol. 39, No. 1, pp. 1-123. https://hepgjournals.org/doi/10.17763/haer.39.1.l3u15956627424k7
Jensen, A. (1973) Educability and Group Differences. Harper & Row. https://libgen.is/book/index.php?md5=501F355B6E474BDC0B7F3130DC3BF9C0
Jensen, A. R., & McGurk, F. C. (1987). Black-white bias in ‘cultural’and ‘noncultural’test items. Personality and individual differences, 8(3), 295-301. 11. http://arthurjensen.net/wp-content/uploads/2014/06/Black-White-Bias-in-Cultural-and-Noncultural-Test-Items-1987-by-Arthur-Robert-Jensen-Frank-C.-J.-McGurk.pdf
Kirkegaard, E. O., & Fuerst, J. G. (2023). A Multimodal MRI-based Predictor of Intelligence and Its Relation to Race/Ethnicity. Mankind Quarterly, 63(3).
Lasker, J., Pesta, B. J., Fuerst, J. G., & Kirkegaard, E. O. (2019). Global ancestry and cognitive ability. Psych, 1(1), 431-459.
Lynn, R., & Meisenberg, G. (2010). The average IQ of sub-Saharan Africans: Comments on Wicherts, Dolan, and van der Maas. Intelligence, 38(1), 21-29. https://www.researchgate.net/publication/222062631_The_Average_IQ_of_Sub-Saharan_Africans_Comments_on_Wicherts_Dolan_and_Van_der_Maas
Lynn, R. (2015) Race Differences in Intelligence: An Evolutionary Analysis, Second Revised Edition. https://www.intelligence-humaine.com/wp-content/uploads/2019/03/Race-Differences-in-Intelligence-second-edition-2015-1.pdf
McGue, M., Bouchard Jr, T. J., Iacono, W. G., & Lykken, D. T. (1993). Behavioral genetics of cognitive ability: A life-span perspective. https://psycnet.apa.org/record/1993-98367-003\
te Nijenhuis, J., & Van Der Flier, H. (2013). Is the Flynn effect on g?: A meta-analysis. Intelligence, 41(6), 802-807. http://citeseerx.ist.psu.edu/viewdoc/download?doi=10.1.1.694.8353&rep=rep1&type=pdf
Piffer, D. (2019). Evidence for recent polygenic selection on educational attainment and intelligence inferred from Gwas hits: A replication of previous findings using recent data. Psych, 1(1), 55-75.
Plomin, R. et al. (2013) Behavioral Genetics, 6th Edition. https://libgen.is/book/index.php?md5=9303B823B96B155DDC249D9267EAD8DC
Protzko, J. (2015). The environment in raising early intelligence: A meta-analysis of the fadeout effect. Intelligence, 53, 202-210. https://www.sciencedirect.com/science/article/abs/pii/S016028961500135X
Rushton, J. P., & Skuy, M. (2000). Performance on Raven’s Matrices by African and White university students in South Africa. Intelligence, 28(4), 251-265. http://citeseerx.ist.psu.edu/viewdoc/download?doi=10.1.1.503.9118&rep=rep1&type=pdf
Rushton, J. P. (2012). No narrowing in mean Black–White IQ differences—Predicted by heritable g. American Psychologist, 67(6), 500–501. https://doi.org/10.1037/a0029614
Sternberg, R. (2000) Handbook of Intelligence. https://libgen.is/book/index.php?md5=7173C0103012053229366179E9546CD3
Strenze, T. (2007). Intelligence and socioeconomic success: A meta-analytic review of longitudinal research. Intelligence, 35(5), 401-426. 1. https://emilkirkegaard.dk/en/wp-content/uploads/Intelligence-and-socioeconomic-success-A-meta-analytic-review-of-longitudinal-research.pdf
Stricker, L. J., & Ward, W. C. (2004). Stereotype Threat, Inquiring About Test Takers’ Ethnicity and Gender, and Standardized Test Performance 1. Journal of Applied Social Psychology, 34(4), 665-693. https://onlinelibrary.wiley.com/doi/abs/10.1111/j.1559-1816.2004.tb02564.x
Wei, T. E. (2008). Stereotype threat, gender, and math performance: Evidence from the national assessment of educational progress. Working Paper, Harvard University. https://web.archive.org/web/20161114181944/http:/isites.harvard.edu/fs/docs/icb.topic630262.files/sthreat_naep.pdf
Weinberg, R. A., Scarr, S., & Waldman, I. D. (1992). The Minnesota Transracial Adoption Study: A follow-up of IQ test performance at adolescence. Intelligence, 16(1), 117-135. 10. http://faktasiden.no/dokumenter/minnesota-transracial-adoption-study.pdf
Wolf, P., Gutmann, B., Puma, M., Kisida, B., Rizzo, L, Eissa, N., Carr, M., & Silverberg, M. (2010) Evaluation of the DC Opportunity Scholarship Program Final Report. https://ies.ed.gov/ncee/pubs/20104018/pdf/20104018.pdf



"Another line of evidence is that the blacks have a smaller standard deviation for IQ than whites (Jensen 1973, 212)."
Don't think so. Your own table from our study above shows slightly larger Black SD.
https://russellwarne.com/2022/12/17/irish-iq-the-massive-rise-that-never-happened/
the irish iq has always been relatively high (98)