


What do SNP Heritabilities Really Tell Us?
That you can explain a lot of phenotypic variance with a surprisingly small fraction of the human genome

People have been talking about the recent GWAS meta-analysis in an understandable way.

The paper gives the SNP heritability estimates shown above. It gives roughly symmetrical confidence 95% intervals for these estimates. So, 95% of the 95% confidence intervals trap the true SNP heritability1 of the trait.
These heritability estimates are significantly less than the relevant twin study heritabilities.

This all leads people like Eric Turkheimer to write stuff like:
This week, a preprint describing a massive meta-analysis of sibling GWAS dropped. The estimate of the direct genetic effect heritability of neuroticism was .081, down from Eysenck’s estimate by an order of magnitude. And scanning across behavioral phenotypes, this heritability was on the high side. Depression (depression!) was .015; drinks per week was .027; income was .024. These are heritabilities, mind you, upper limits on what we could expect any real world polygenic score to accomplish, and it would take millions of sibling participants to accomplish that. Cognitive performance was a little higher, at .188, for example, but the corresponding polygenic score accounted for essentially zero variance. An excellent summary and analysis has been posted by Sasha Gusev, here. Sasha argues (the fine points are over my statistical genetic head) that even these estimates are biased upward. He places the direct heritability of cognitive ability at closer to .12.
But Gusev says:
Switching gears from common variants, the second sibling-based paper this week [Sidorenko et al. (2024)] used a very large number of siblings to estimate, with some assumptions, the total heritability for height and BMI … so what did they actually find? The total sibling heritability for height was 0.76 and for BMI was 0.55. This is in contrast to a common variant heritability (estimated using unrelated individuals in these cohorts) of 0.50 and 0.26 for height and BMI respectively. Even more striking, the BMI estimate of 0.55 was substantially higher than a prior estimate of 0.30 obtained using whole-genome sequencing data that directly captures rare variation. Thus there is evidence that some combination of ultra rare mutations (or other variants not captured by sequencing of either genomes or exomes), or GxG, or GxE, or cross-sibling effects can increase the variance explained by 1.5x for height and 2x for BMI relative to that of common variants.
So it would seem that statistical genetics people know something that isn’t clear to outsiders like Eric Turkheimer: SNP heritabilities are distinct from “total heritabilities” is that their confidence intervals may not actually trap the true heritability anywhere near 95% of the time.2
Why is this?

Here’s a supplementary table from the new GWAS meta analysis. To confuse people like Turkheimer less, an importance statistic from this probably should have been in the main article. That statistic is the number of SNPs in the model. It’s in the 7 figures.
There are 3 billion base pairs in the human genome, which makes 10 figures. That means this model includes <1% of the human genome.
But maybe that’s okay — maybe only <1% of the human genome varies. Let’s test that idea. Assume you know the remaining 2.7 billion base pairs have 0 covariance with the trait of your choice.
You take 180,000 people, the highest meta-analytic sample size in the paper (it was for height), and you compute the covariance of each base pair with height. Assuming your model of 0 covariance, 0 linkage disequilibrium is implied. When you add up all of your covariance estimates, you end up somewhere in here:
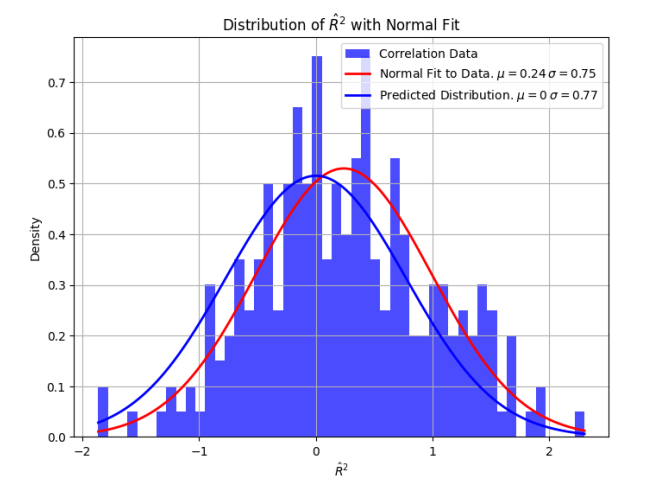
If you repeat this experiment thousands of times, with the same number of base pairs and participants, you will get the above distribution of total genome heritability R^2. This chart comes from a preprint I posted here.
So if you do it once, you could get 1, and you can’t tell if that’s because micro variation over the 2.7 billion base pairs really do explain the rest of the variance, or if it’s just noise from your relatively low sample size of 180,000 people.
What we actually have in the recent meta-analysis, then, are lower bounds on the true population SNP heritability that come from computing the confidence interval of the variance explained by a small subset of highly varying SNPs. The SNP heritability could actually be called the “subset of SNPs” heritability. With this change, 95% of the confidence intervals in the first chart will trap the true “subset of SNPs” heritability, i.e. the variance explained by the small subset of SNPs used in the meta-analysis.
But this is not exactly communicated clearly by the GWAS people, who often seem to want to persuade outsiders of there being something “wrong” with twin study estimates of heritability, even though we checked the assumptions underlying the method and found nothing off, at least when it comes to IQ. SNP heritability actually being subset of SNPs heritability is a pretty important point, and it’s literally not mentioned anywhere in the meta-analysis — I had to dig into the supplement files and do my own math to figure it out, as someone who isn’t a GWAS person.
One final caveat to end off with: I’m not 100% certain in my analysis here, because of the obscurity of GWAS statistical methods. To compute subset of SNPs heritability, the don’t use OLS, they use GREML or LD score regression. Whereas OLS is assumption free, these methods are loaded with assumptions, that seem to be less verified than those behind twin studies. I also can’t find results about their equivalence to OLS estimates. I currently have seen no proof that these methods produce unbiased estimates when their assumptions are satisfied, or how to measure their bias when the assumptions are not satisfied. It’s unclear why we should exchange one set of tested assumptions for another set of assumptions that are more complex and less tested. “Molecular", I guess?
But if anyone is more knowledgeable about these methods and has any good reading for me, leave a comment. I haven’t found good books on GWAS, probably because the field is new and niche within statistics, but I’m currently reading something on random effects and REML.
Edit:
The creators of GREML give the same standard error for their variance explained as I derive in my preprint:
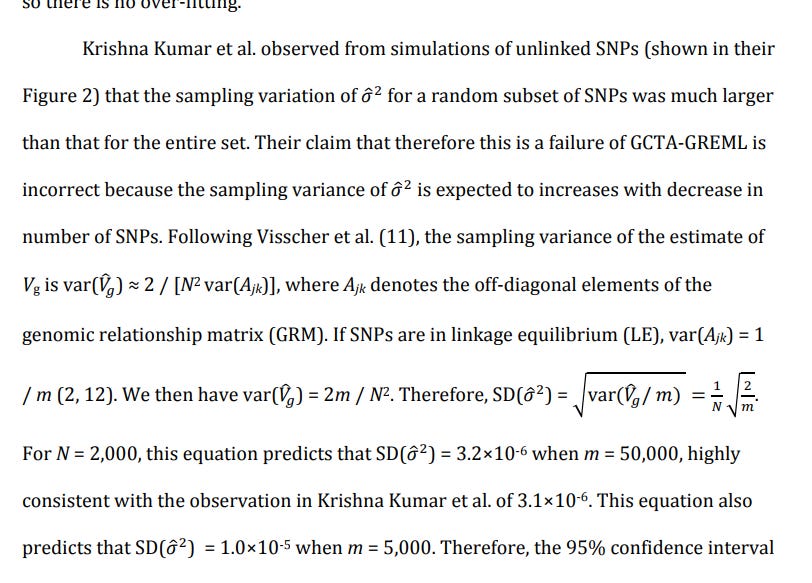
They also write:

See “using the same SNP chip”, ie the same micro-subset of SNPs.
My certainty in there being a miscommunication from the GWAS people on SNP h^2 actually being micro-subset of SNPs h^2 has gone quite up.
Some readers might think “of course, SNP heritabilities are narrow sense!” But SNPs don’t capture all of the additive heritability — rare variance are additive.