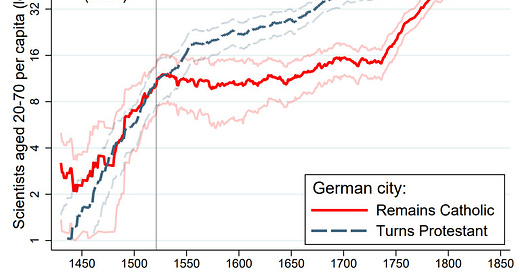
Cremieux wrote a new article called The Ottoman Origins of Modernity. In it he argues that Ottomans preventing protestants from being snuffed out in the cradle led to modernity. As is the standard for Cremiuex, it’s completely packed with data — as well as an advertisement for a startup payroll manager that interrupts the beginning and middle of the article. Is this the first commercial in a Substack article? Could be.
What’s missing from the article, however, is any mention of genetics and evolution. There seems to be a wide-spread idea that evolution over this time scale is implausible and therefore does not need to be considered, tested, contrasted with alternative hypotheses, and integrated with knowledge of non-genetic forces. This idea is totally false and it’s holding back the median understanding of history immensely.
What selection pressure is needed to produce Cremieux’s graphs?
These lines can actually be 100% genetic evolution. They may also be anywhere between 0% and 100%. Let me explain.
Change in the mean of a trait over time is the easiest to analyze. Usually, direction selection pressure resulting from correlations between traits and fertility does not change a trait’s variance or distribution much.
What we see above is the proportion of a population that is a scientist. How do we relate this to the mean of a trait? It’s probably a threshold function of the IQ distribution. A simple model we can use is that some fraction of everyone over, say, 130 IQ, becomes a scientist, while nobody under that threshold does. If the mean IQ is increasing due to evolution, there will be more people over 130 IQ (relative to time 1), and therefore there will be more scientists.
When a population mean changes, it can be due to evolution or some other force. It can also be a mixture of both. If IQ goes from 100 to 102 in a generation, it can be because the genotypes went up such that the new mean phenotype will be 102. It can be because the environment went up such that the new mean will be 102. It can also be because the genotype went up by 1 phenotypic point, and the environment went up by 1 phenotypic point, producing an observable change of 2 points.
This is the superposition principle of sociobiology. This really should be burned into every human behavior scientist’s mind at grade-point, but instead they learn social psychology and neoclassical economic theory.
So now any time you see a change in a trait mean over time, you get to measure plausibility of it resulting from selection pressure by using the breeder’s equation and assuming the mean force from everything else is 0.
The change in mean phenotype that results from selection pressure is equal to the additive heritability of the trait multiplied by the correlation between the trait and fertility multiplied by the standard deviation of fertility divided by the average fertility.
In modern times, for a trait like IQ, the terms except for the correlation, which is between 0 and 1, come out to about 3/8. It’s unclear how this might have differed in the past — IQ might have been less heritable, but the standard deviation of fertility may have been larger than the mean. But if we use 3/8 as an approximation of those terms, we get that the selection pressure can be between 0 and .375 SDs per generation.
This means that selection pressures of 1 IQ point (<0.1 SD) per generation are quite easy to produce. You only need a small correlation between fertility and IQ for this to happen.
Right now, many countries are losing >1 IQ point per generation due to a negative correlation between IQ and fertility. So changes at the mean due to selection of about 1 point for every 25 years are easily plausible in either direction.
from scipy.stats import norm
import matplotlib.pyplot as plt

THRESHOLD = 2.5 # IQ threshold w.r.t. start where scientists can occur
GENERATION_TIME = 20 # number of years in a generation

for j in range(10):
    PRESSURE = j/25 # per generation increase
    percent_scientists = [(1-norm.cdf(THRESHOLD-(PRESSURE*i/GENERATION_TIME))) for i in range(400)]
    min_percent = min(percent_scientists)
    percent_scientists_std = [i/min_percent for i in percent_scientists]
    plt.plot(percent_scientists_std, label=f'Pressure: ({round(PRESSURE,3)} , {round(PRESSURE*15,1)}) IQ SDs,points / gen')

plt.xlabel('Years from Beginning')
plt.ylabel('Per capita')
plt.title('Number of Scientists')
plt.legend(title="Pressure Values", bbox_to_anchor=(1.05, 1), loc='upper left')
plt.yscale('log', base=2)
plt.show()
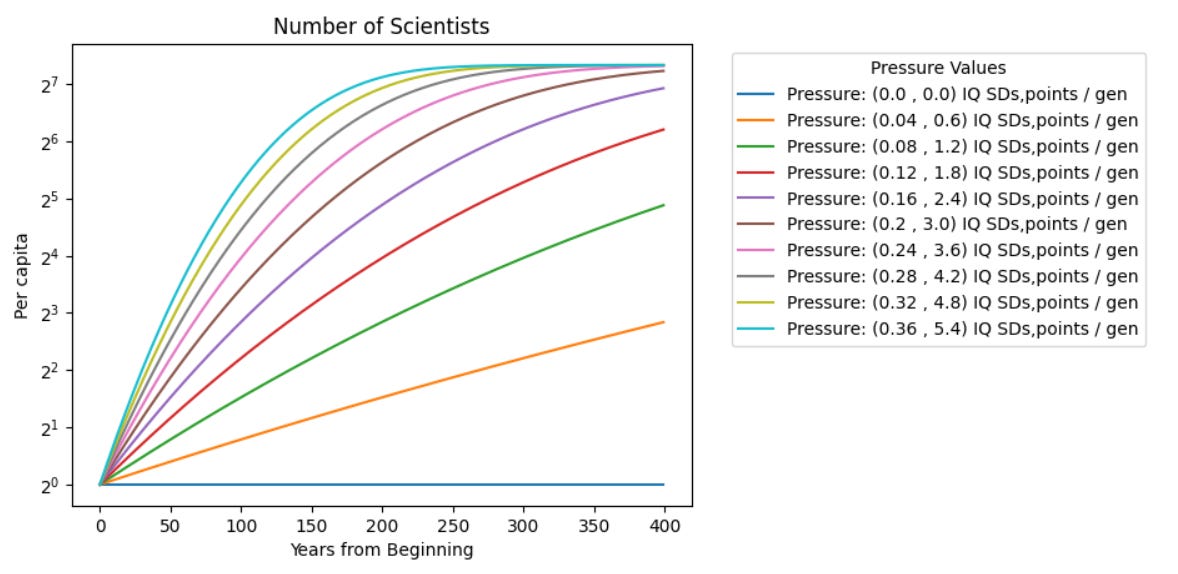
Using a similar threshold model to the one in this article, we write the code above and get the following chart:
The purple curve fits Cremieux’s data pretty well. It’s right in the middle of the plausibility range for selection pressure, given a threshold of 37.5 points above the original mean, which isn’t crazy if the beginning mean was 85 or 90 relative to today.
However, the overall increase in genetic IQ from this curve over 400 years is very unlikely — it would be 3.2 SDs. 25% to 50% of this number seems more plausible given writings from the time, current race differences in IQ (the dumbest races have a mean about 2 SDs under current whites, although we may have lost 1 SD since 1850).
The green curve plus a doubling “cultural” pressure would give a 1.6 SD increase over 400 years and yield the result Cremiuex observes. Importantly, selection is all important in this model, as the “cultural” amplification follows genetic evolution causally. It works like this: selection pressures make more smart people, which create a smarter environment than the previous generation, which creates more smart people. However, assuming it’s pretty trivial to upgrade the environment like this, i.e. it takes <1 generation, this change will not recur without genetic evolution coming first, creating a new generation that finds their inherited institutions inadequate for their own nature. If the next generation is the same as the first, and it is easy and rapid to shape institutions, then there will probably be no reason to change them further.
Under this model it makes little sense to talk about non-genetic changes outside of the context of underlying biological evolution. As far as I know, this model has a lot of evidence going for it and other models are hardly mathematically coherent or empirically supported. You can read more in chapter 2 here.
Conclusion
I know the math is more complicated than verbal descriptions, as well as theory-free statistics, but I hope everyone takes away the main point of this article, which is that biological evolution is plausibly the driving factor behind most social change, and is almost certainly a serious piece of the puzzle.
As for empirical confirmation, Piffer & Kirkegaard found that a process of this magnitude played out in the Roman empire. They found a >1 SD PGS difference between time periods in ancient Rome.
As for the causal importance of “Protestantism”, religion should be treated as a reproductive strategy, and different religions are different populations, or breeding groups. So the mechanism through which the Protestantism effect works is racial/biological. They have different selection pressures owing to different behaviors, ecologies, and base genomes.
The idea that these were the same people with two different books, or verbal interpretations of the same book, etc, is almost certainly not the full picture, nor is it even a mathematically coherent one.


